Tradingview is an incredibly powerful charting and analysis tool, it’s easy to get lost in all the choices and possibilities at first. We recommend making a simple setup of Tradingview which is good to start from.
When you start Tradingview suggests that you first set up a number of different watch lists, they can e.g. be watch lists on your/your portfolios, planned trades and recurring key graphs (perhaps those that describe the market situation).
Once you have the watch lists you initially need, it’s time to give the graphs your own design touch. The default settings in Tradingview provide Green/Red Candlestick charts. Many traders choose to replace those colors with some more neutral than green/red that do not create unnecessary emotions. To change the colors in a graph, just double-click on the element you want to change the color of. When you are satisfied with the colors, press New Layout, then give the layout a name, e.g. “MyFirstLayout”.
We recommend performing the following settings, in 3 steps, when getting started with Tradingview. By doing some basic setup, you’ll get a good feel for the program and a baseline for trading that you can later sharpen by adding additional designs, indicators, and watchlists.
Basic set up for trading, watch list and customized layout (colors and indicators)
- Create an empty watch list, “Create new list” see Figure 1. Then fill your watch list with the desired currencies, see Figure 2.
- Create your favorite layout and save as a layout template, see figure 3 and figure 4.
- Add your favorite indicators and add them to layout template, see Figure 5.
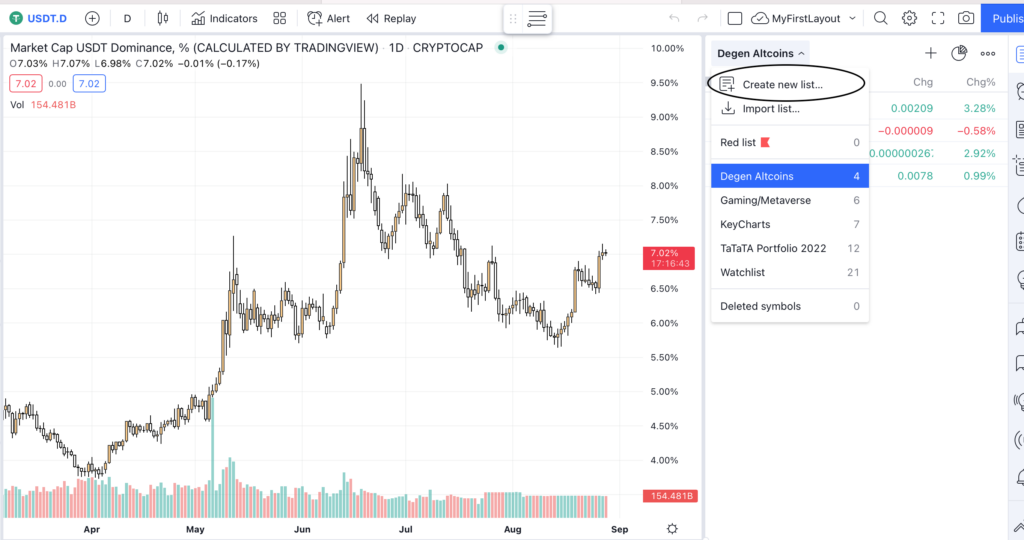
Figure 1 – Save a watch list
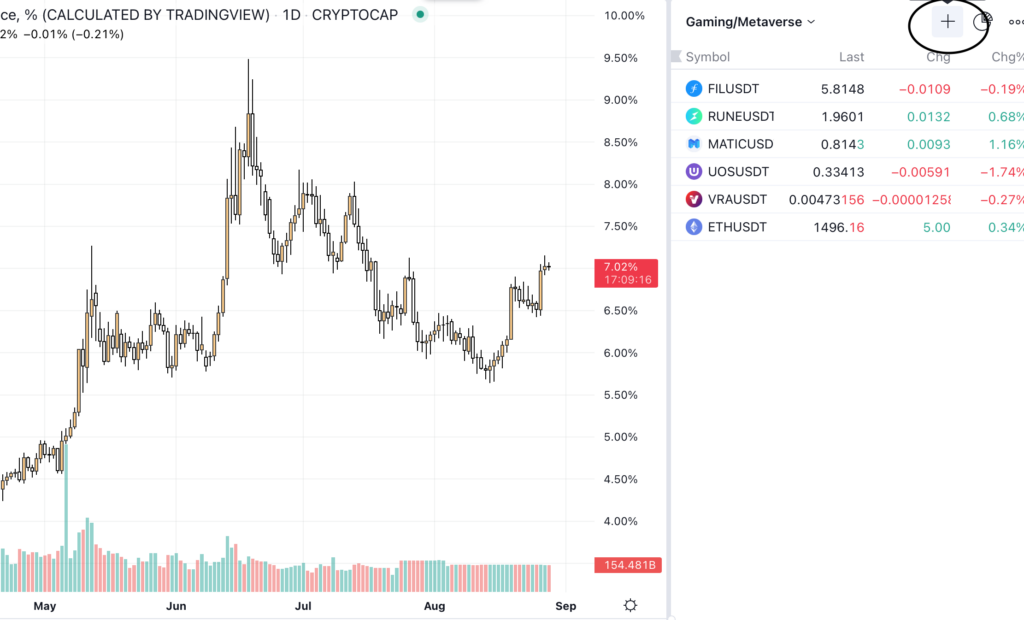
Figure 2 – Press the “+” sign and add the cryptocurrencies to your watch list
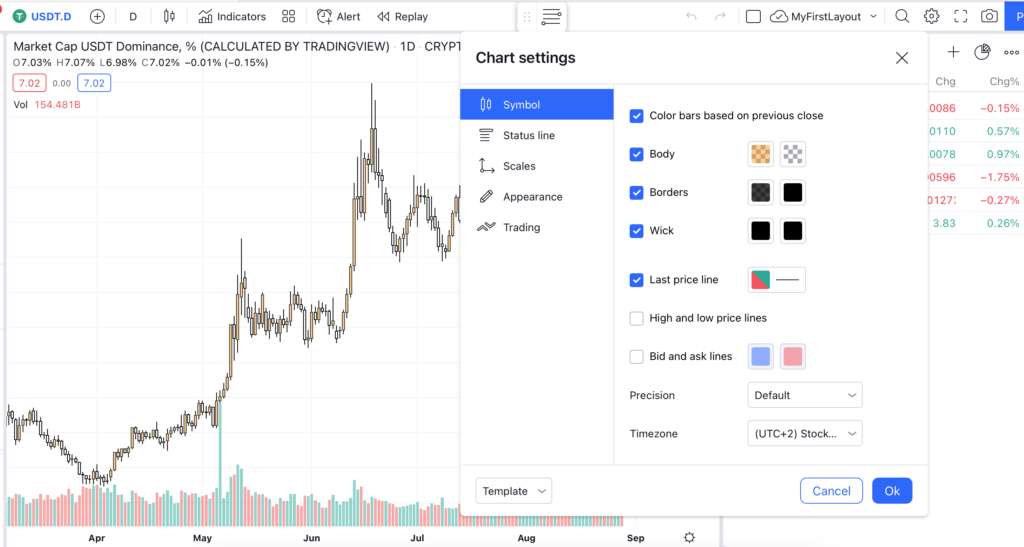
Figure 3 – Click on any element in your graph to change its colors.
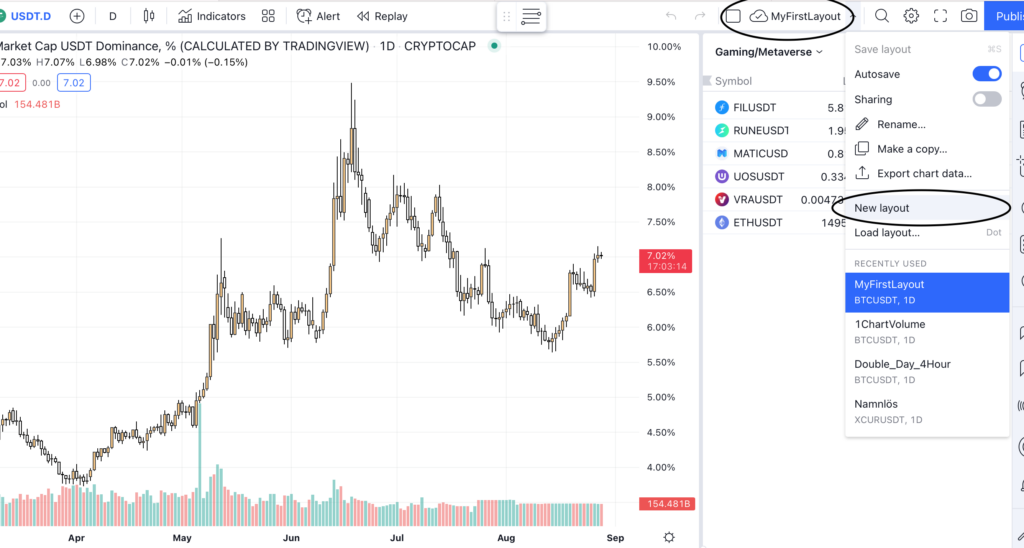
Figure 4 -When you are happy with the colors in your graph, select New Layout. Give the layout a name, e.g. “MyFirstLayout”. When you later feel that you want to change something further in an already saved Layout, make the change and then on the circled cloud symbol in the graph.
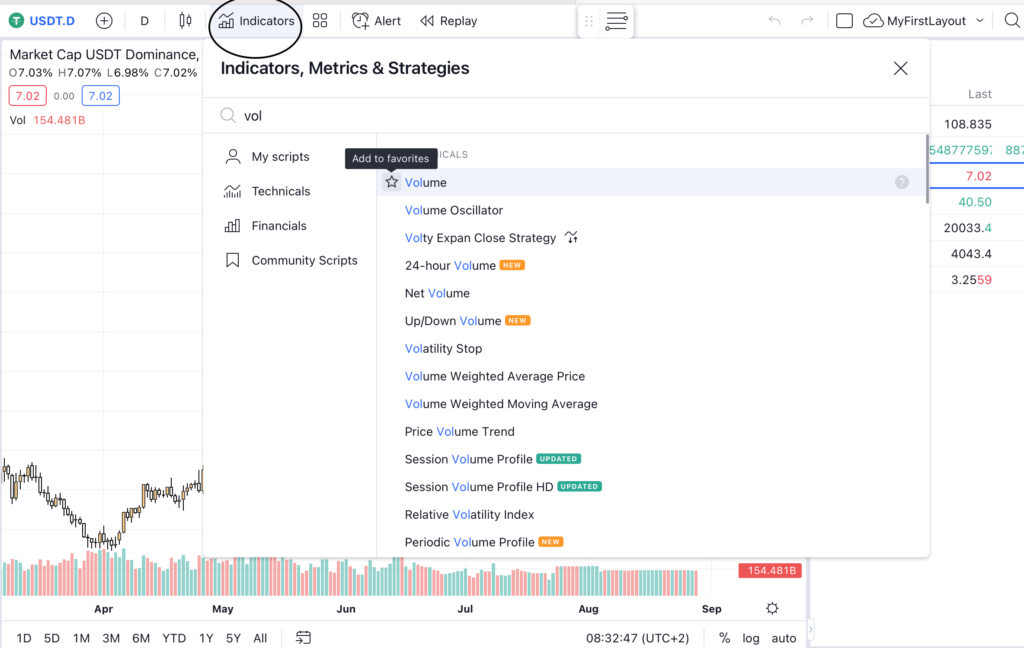
Figure 5 – To make the Layout more complete, it may be appropriate to add your favorite indicators that you “always” look at. Press the “indicators” button and find your favorite indicators and star them to add them to the graph. To then permanently save the indicators in your favorite layout. Do as in Figure 4, tap the cloud icon again.
Now you hopefully have a watch list and a graph template that you like and possibly your favorite indicators.
Time to trade – set your window design
Depending on what type of trader you are and where you are when you trade determines how you set up your windows. If you’re on the move and don’t have access to a large screen, you don’t have the same opportunities to have a detailed overview of your trades. The window design is an important component in your trading and can actually have a big impact on which trades you carry out.
There is no right or wrong when it comes to window design. But it is good to know what possibilities are available, so the settings can be adapted to the conditions of screen size etc. If you have a paid version of Tradingview, you can have several different windows next to each other. The Pro version, which is the cheapest version, allows you to have 2 windows next to each other. That’s plenty for most traders. With more lavish versions of Tradingview, you can have up to 8 windows in the same window next to each other.
Below is an example of how to set up a simple but very powerful 2-window layout. If you are a swing trader and work with a timeframe of 4 hours and 1 day (often a good time combination for Cryptocurrencies), you often want to see how your rate looks both in the shorter term (4 hours) and a little longer (1 day) without having to changing windows.
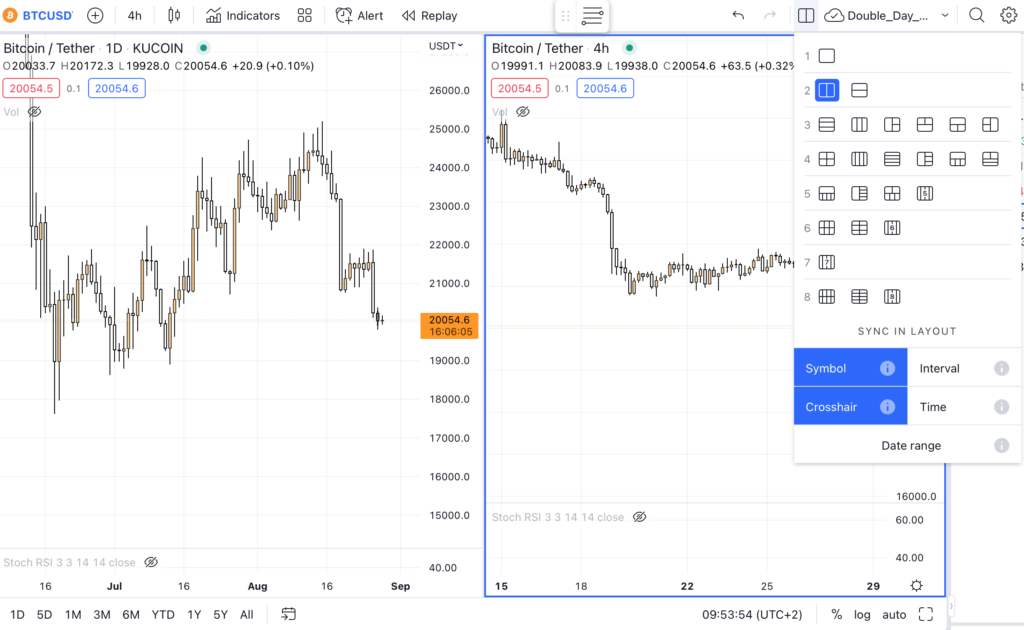
Figur 6. – Tradingview Layout, double window